Buyin - $10+$1
Games Played - 163
ROI - 9.93%
Winnings - $178 USD
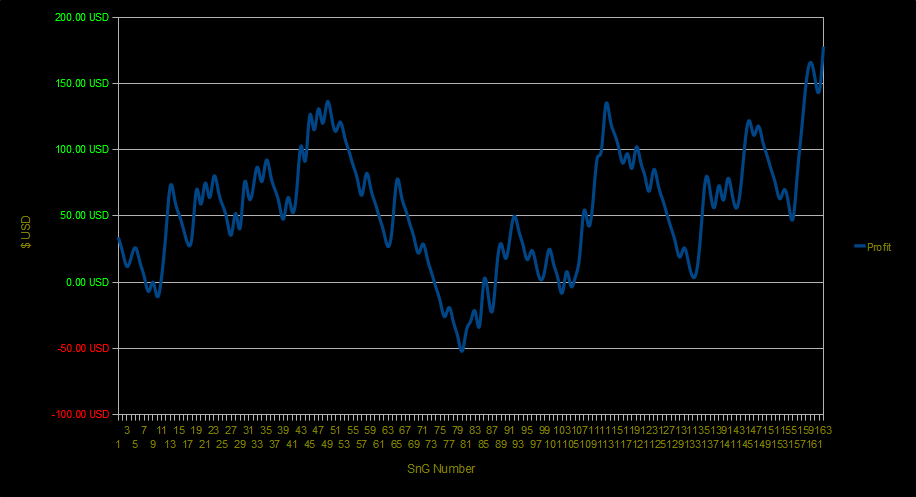
You may notice that this is slightly lower than my reported results at this level, during the data collation I noticed that I had made an arithmetic error which had lead to me believing I had won $30 more than I actually had.
Buyin - $20+$2
Games Played - 89
ROI - -20.02%
Winnings - -$392 USD
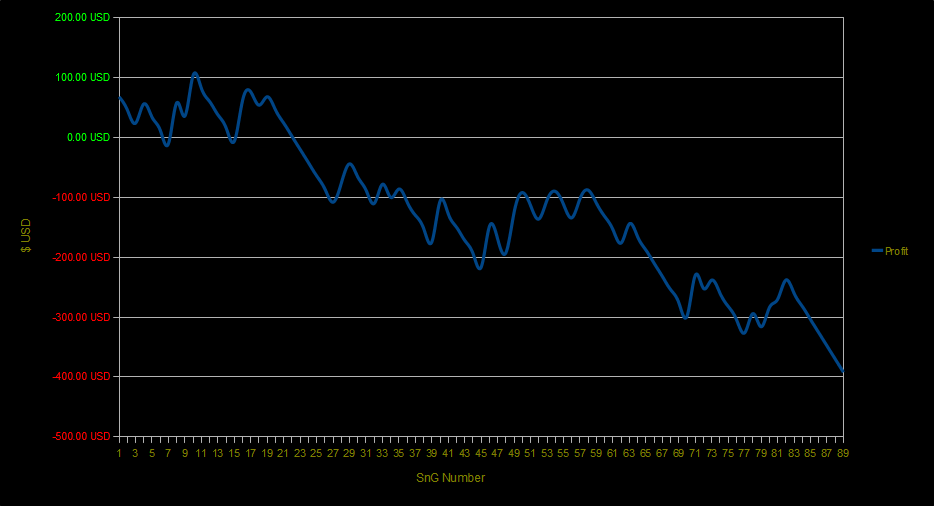
This was quite a severe beating and at this point I decided to call it a day on this attempt. After reviewing my results and the reasons for those results I determined that there were some serious leaks in my game - one of which was that I felt like I was chasing the game, over playing the game to try and get back to a positive return which had a further detrimental affect on my results.
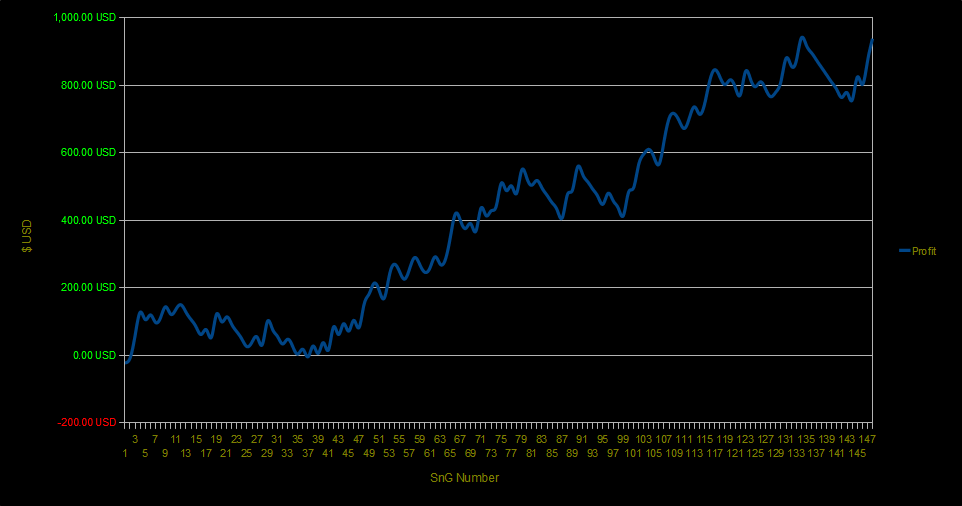
Buyin - $20+$2
Games Played - 148
ROI - 28.8%
Winnings - $938 USD